
 STEP 3 OF 5
Process
Move from raw inputs to structured information ready for analysis and reporting, transparently aligned with reporting methodologies.
 Scope 1 & 2 calculations
Data visualisations
Structured exports
Scope 1 & 2 calculations
Data visualisations
Structured exports
SCOPE 1 & 2 CALCULATIONS
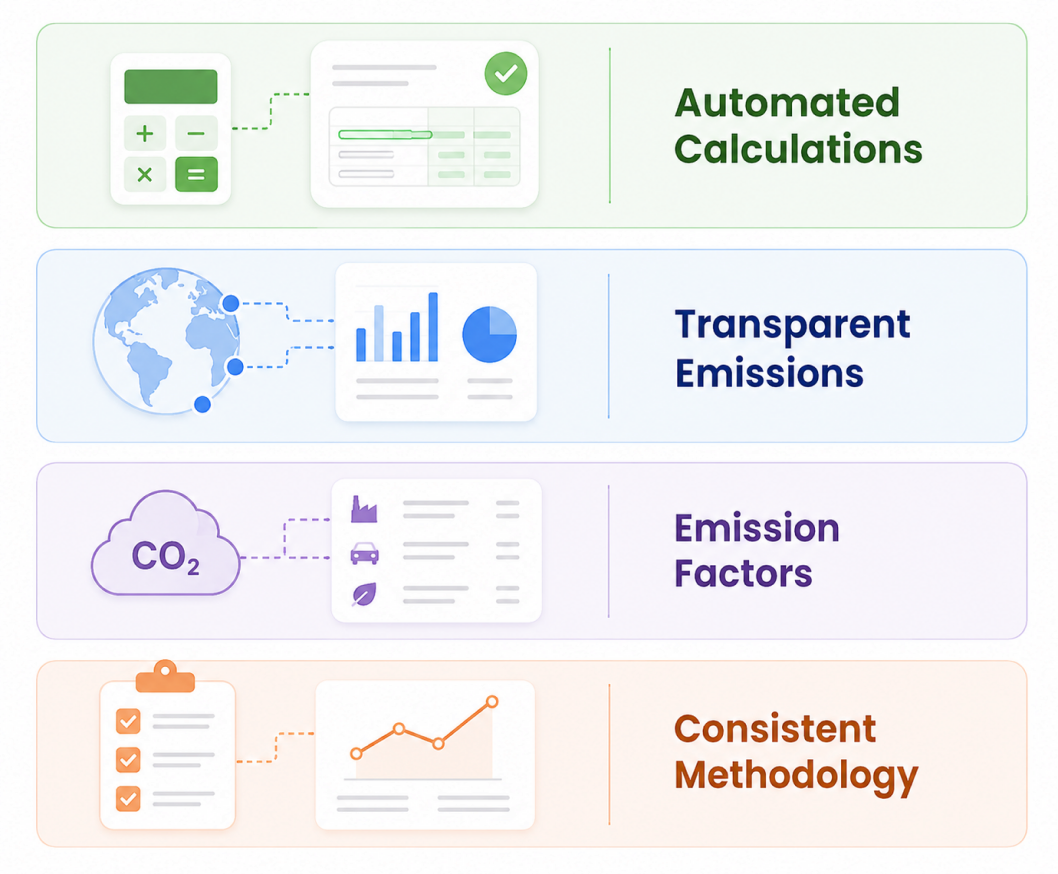
Automated emissions calculations
Scope 1 and Scope 2 emissions are calculated using recognised emission factors and transparent methodologies, helping organisations convert operational inputs into reliable carbon metrics.
 Automated calculations from structured activity data
 Transparent emissions logic with every input traceable
 Emission factors: DEFRA, IPCC, and regional sources
 Consistent methodology across all entities
DATA VISUALISATIONS
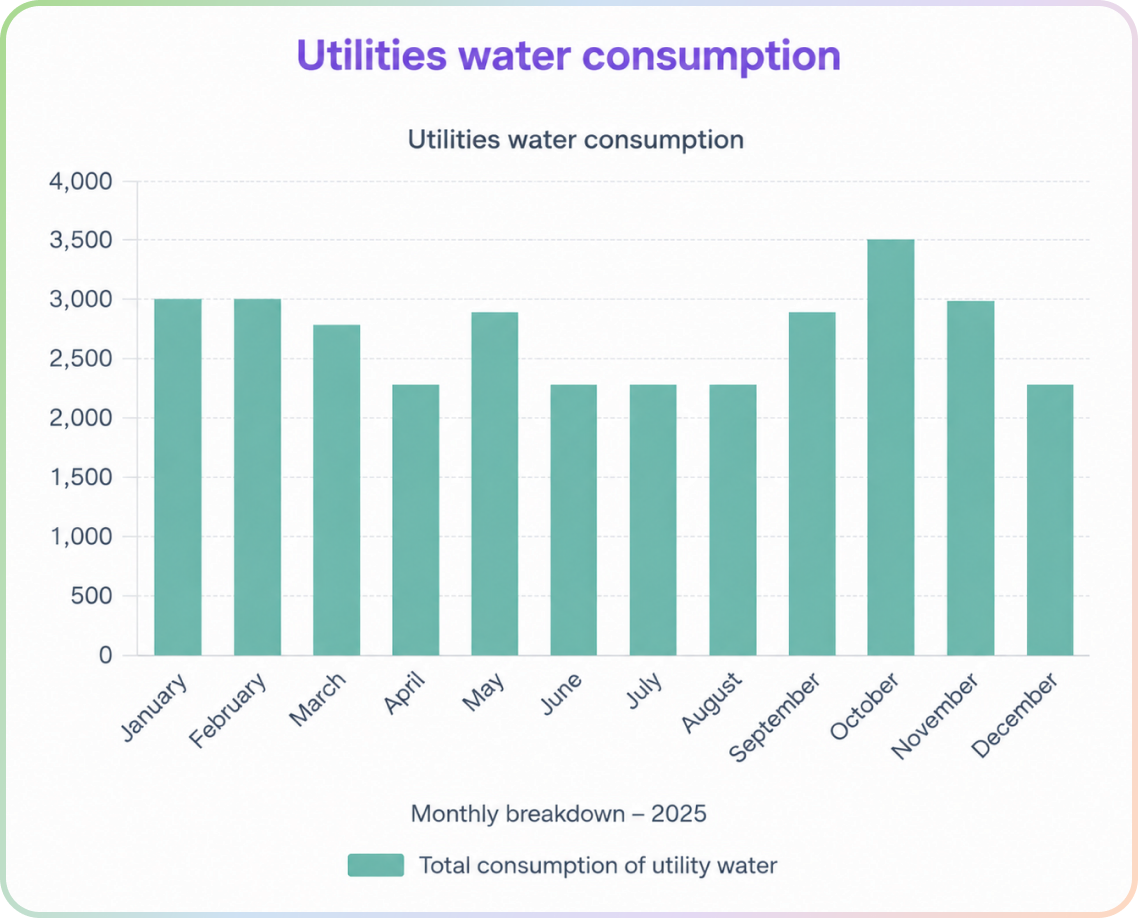
Transform processed data into clear ESG insights
Charts and visual dashboards display validated ESG data, allowing teams to monitor performance, identify trends, and understand reporting progress throughout the cycle.
 Custom graphs from validated data points
 Performance tracking across entities and topics
 Completion dashboards by contributor and topic
 Configurable views for different stakeholders
EXPORTS
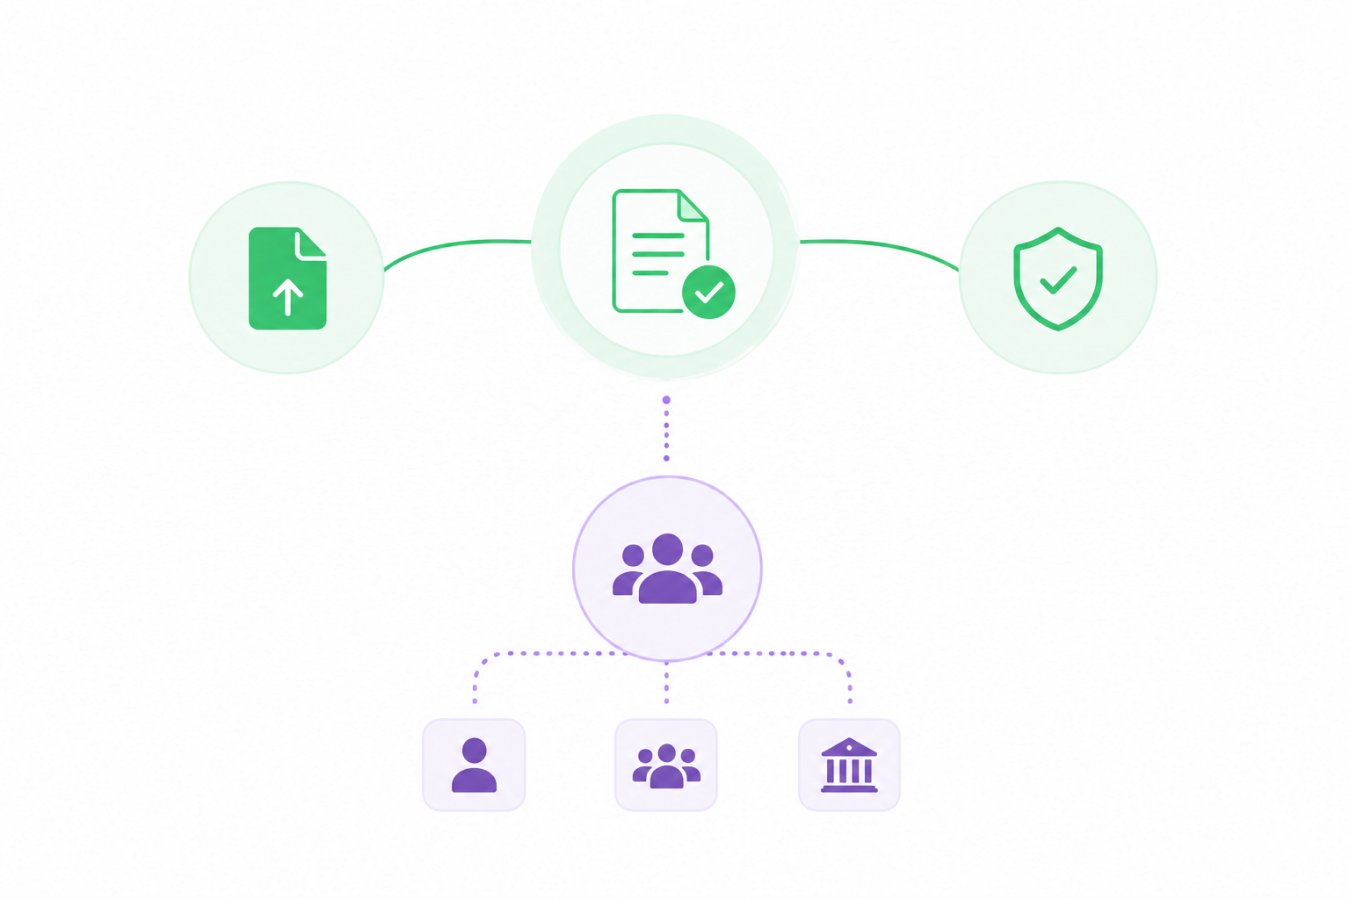
Structured ESG data, ready for external use
Validated datasets are exported for reporting, analysis, or advisory work, maintaining consistent formatting aligned with the reporting structure.
 Export datasets in structured formats
 Consistent formatting aligned to framework structure
 Shared with advisory, internal teams, or external stakeholders
Turn raw data into verified outputs
See how Squarely calculates, visualises, and structures your ESG data: transparently, consistently, and ready for reporting.